The Accounting PhD Job Market in Charts
I have been on both sides of the accounting PhD job market, as a candidate and as a faculty member reviewing applications. Either way, the same question comes up every fall: how does this year compare? To answer that, I pulled together six years of data from the community Google Sheets and SSRN’s Accounting Research Network job openings.
A word on the data: These spreadsheets were, and are, maintained by volunteers. As the sheets became more widely known, more people contributed. That is good for recent coverage, but I suspect it also means the upward trend in recorded postings and placements partly reflects growing adoption of the spreadsheet itself. Keep this selection effect in mind throughout.
Disclaimer: I used LLM support to extract and standardize the data because the original spreadsheets are, to put it gently, a mess.
When do jobs appear?
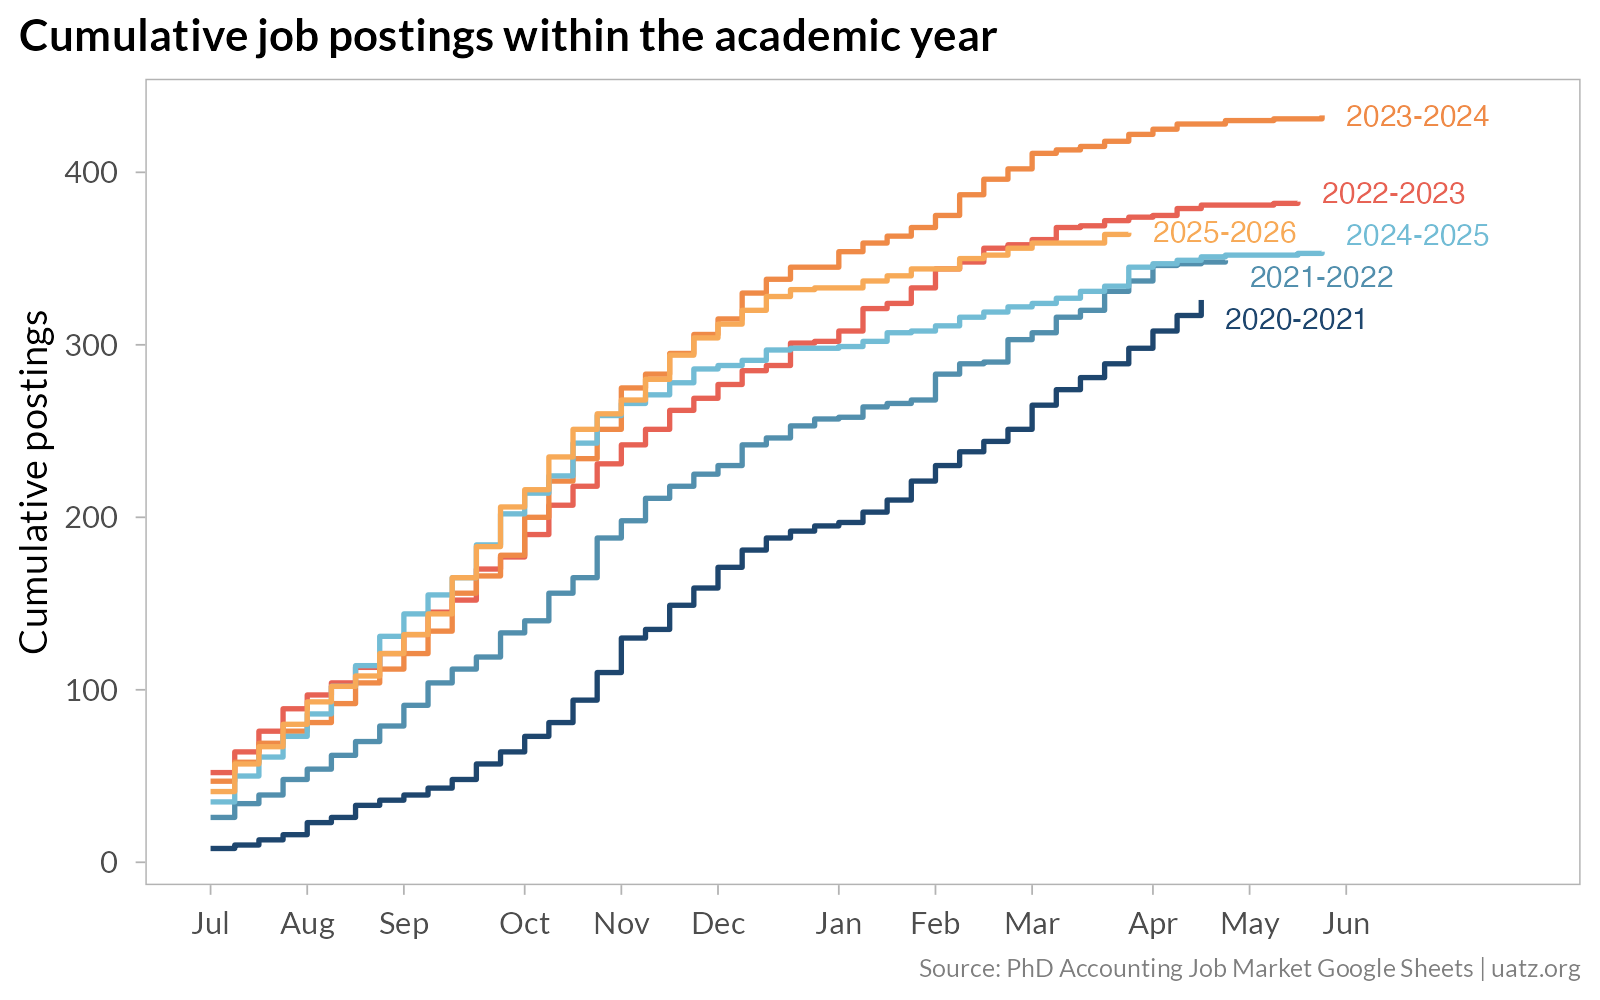
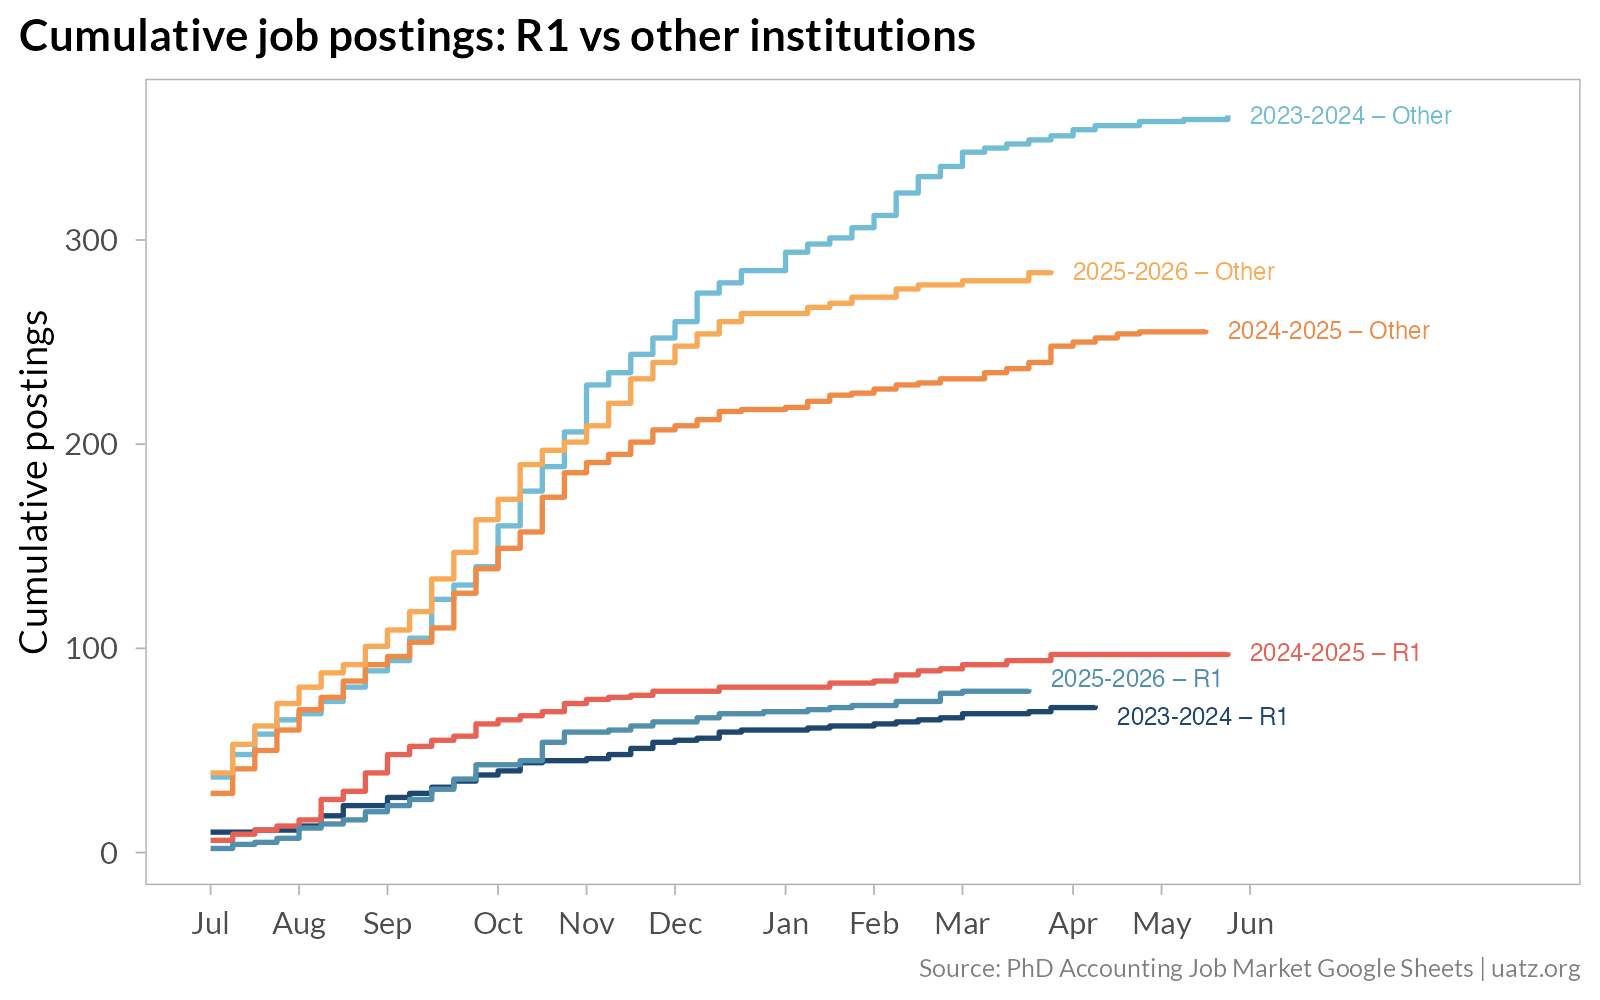
The cumulative postings chart is the most useful view of the hiring cycle. Each line traces one academic year from July through June. Across all years, the steepest part of the curve falls between August and November. By December, roughly three-quarters of postings are already live.
Who gets placed where?
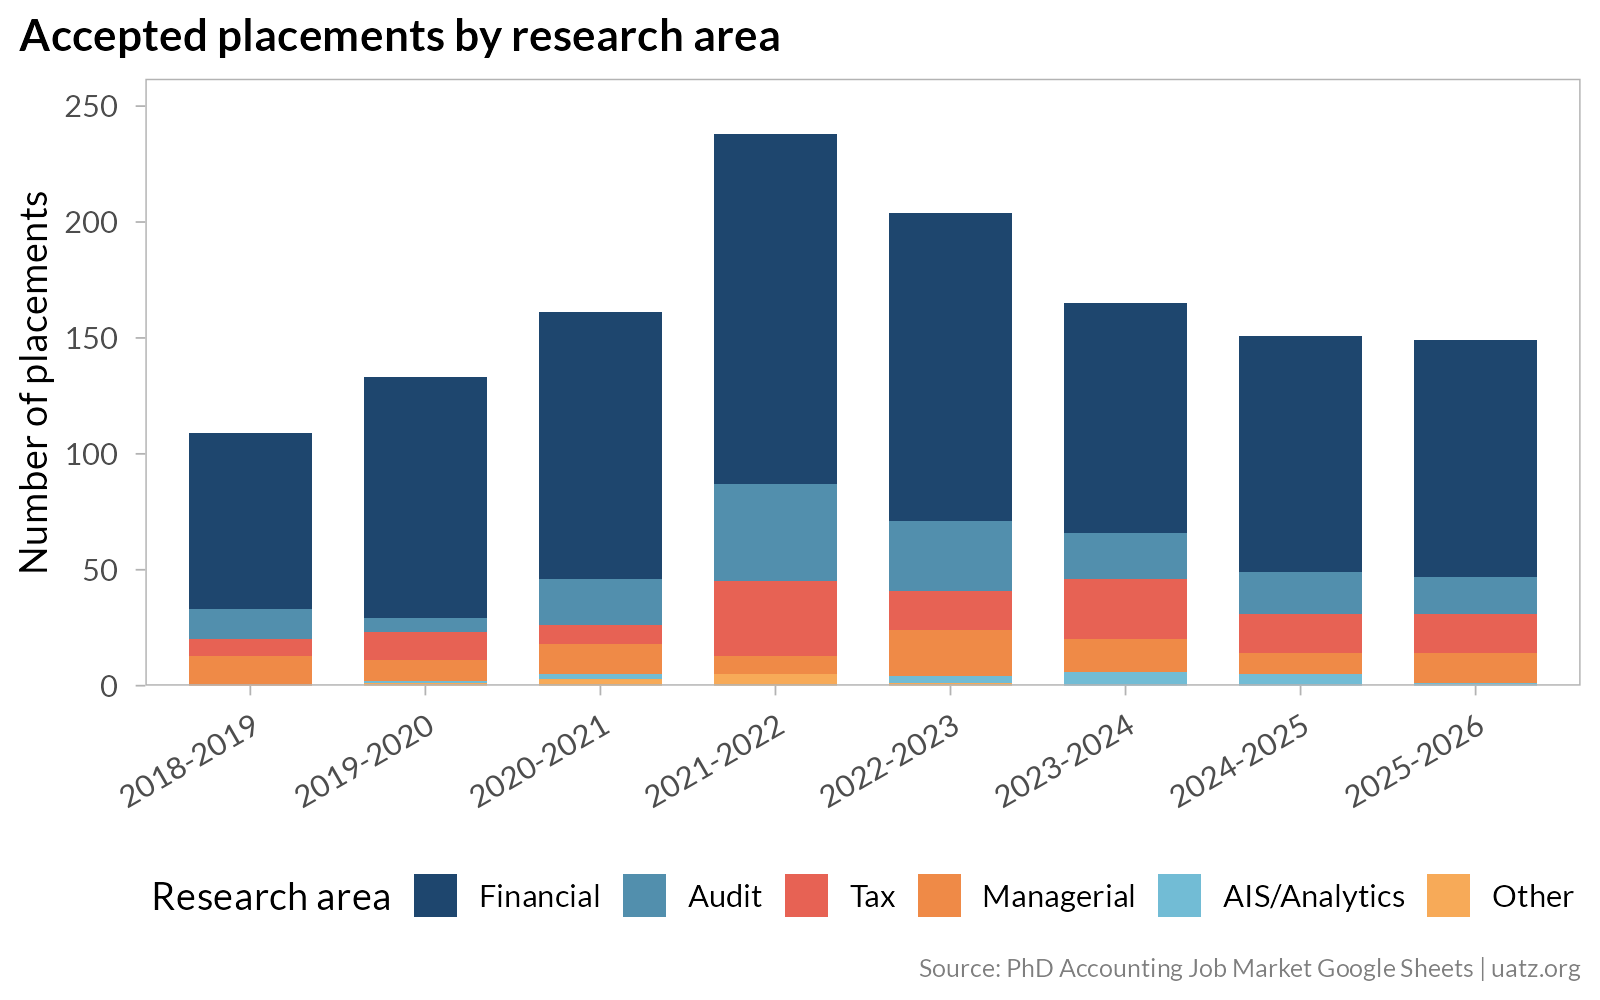
Financial accounting dominates placements, accounting for roughly two-thirds of accepted offers in most years. Audit is a distant second, followed by tax, managerial, and AIS/analytics. The relative shares have been stable.
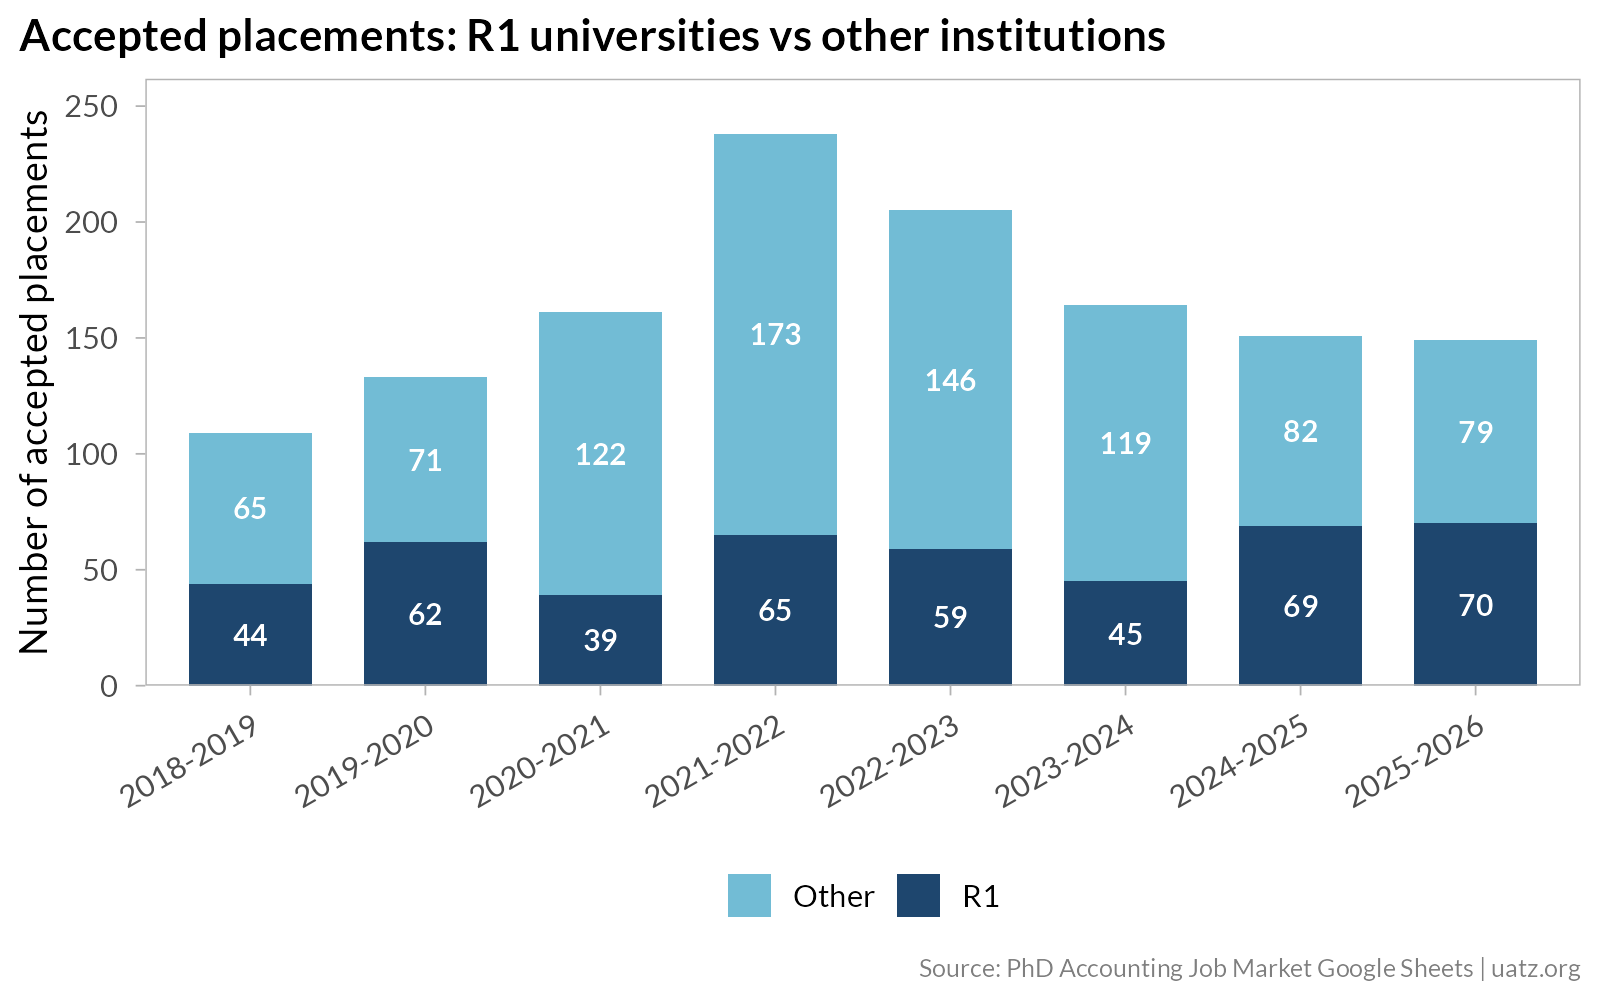
How many placements per year?
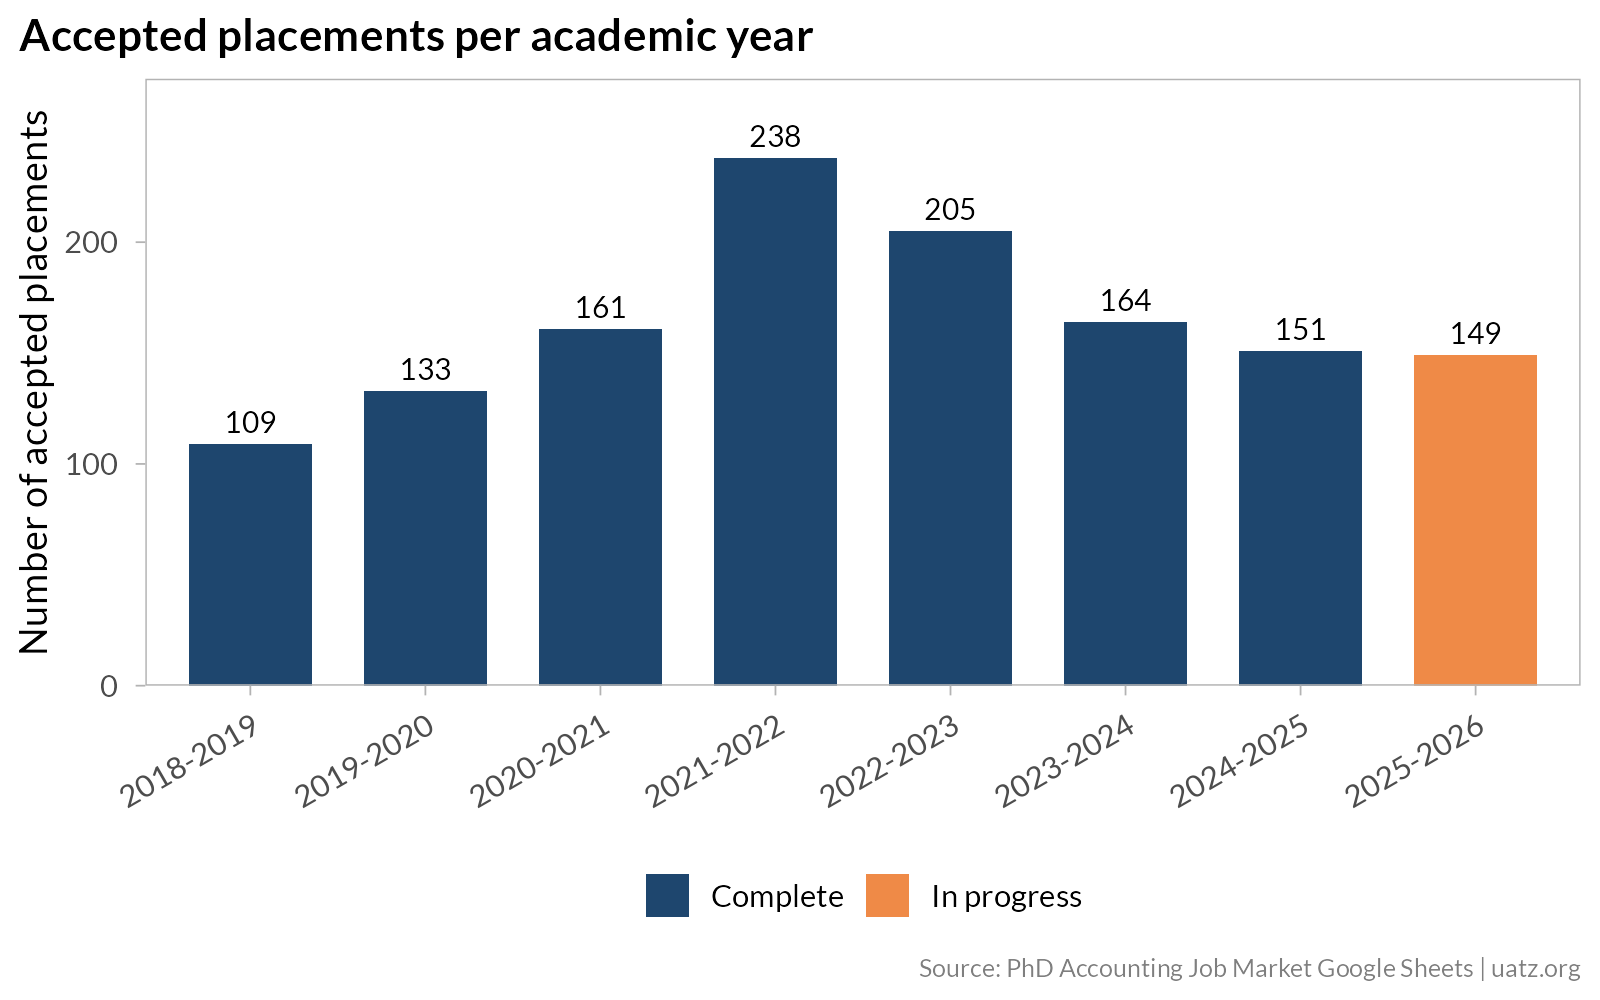
This chart should come with a warning label about the dynamic of posting on the internet. Initially, I assumed the spike in 2021-22 (238 placements) was simply a recovery from the first COVID year. However, it likely also reflects the spreadsheet reaching peak popularity. The years before 2020 had fewer contributors, and the recent decline may partly reflect a reluctance to participate. That said, the trajectory from 2023-24 onward (164, 151, 149 so far) is consistent with a tighter market. The 2025-26 cycle is still in progress, so the final number will be higher.
US vs. international
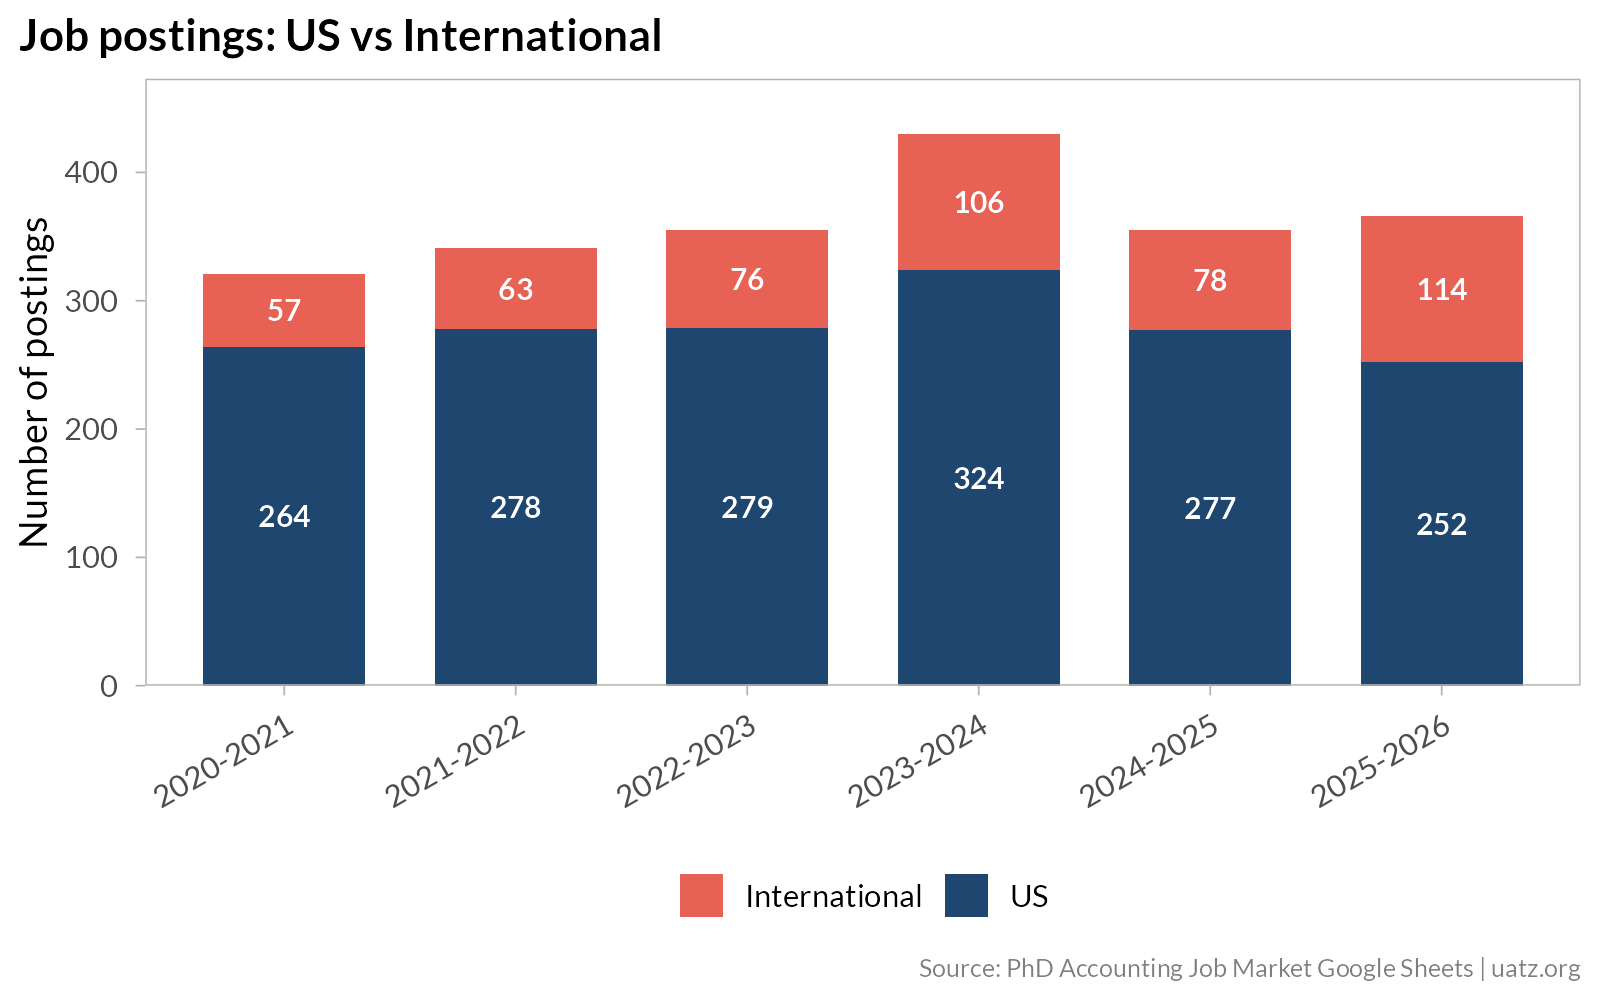
The geographic mix of postings has shifted. In 2020-21, about 82% of recorded postings were at US institutions. That share has fallen to 69% in 2025-26. Some of this reflects broader adoption of the spreadsheet outside the US, but it is also consistent with fewer openings in the US and growing demand for accounting PhDs at universities in Asia and Europe.
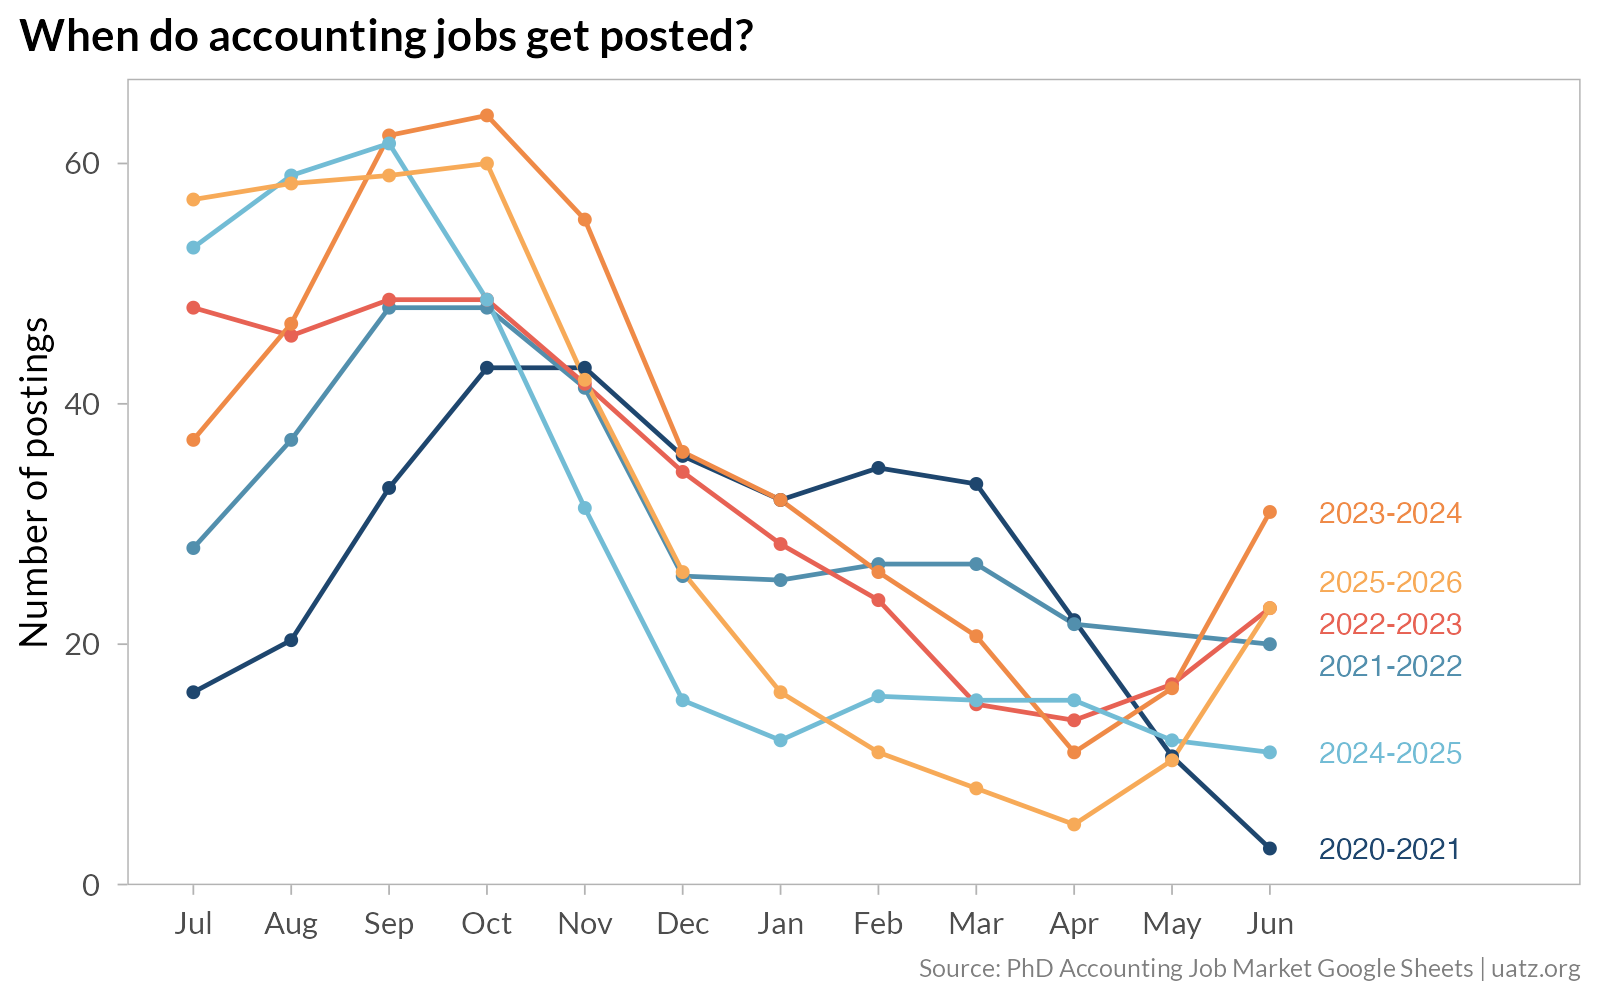
Posting timing within the year
As expected, most accounting jobs are posted between July and November. The peak month is typically September or October. After the holidays, the flow slows to a trickle, with only late-cycle positions (visiting, lectureships, failed searches) appearing in spring. For candidates, the practical implication is straightforward. Your materials should be ready by September, latest. There is some indication that the timeline is moving early, for example, more postings appear already in June in later years.
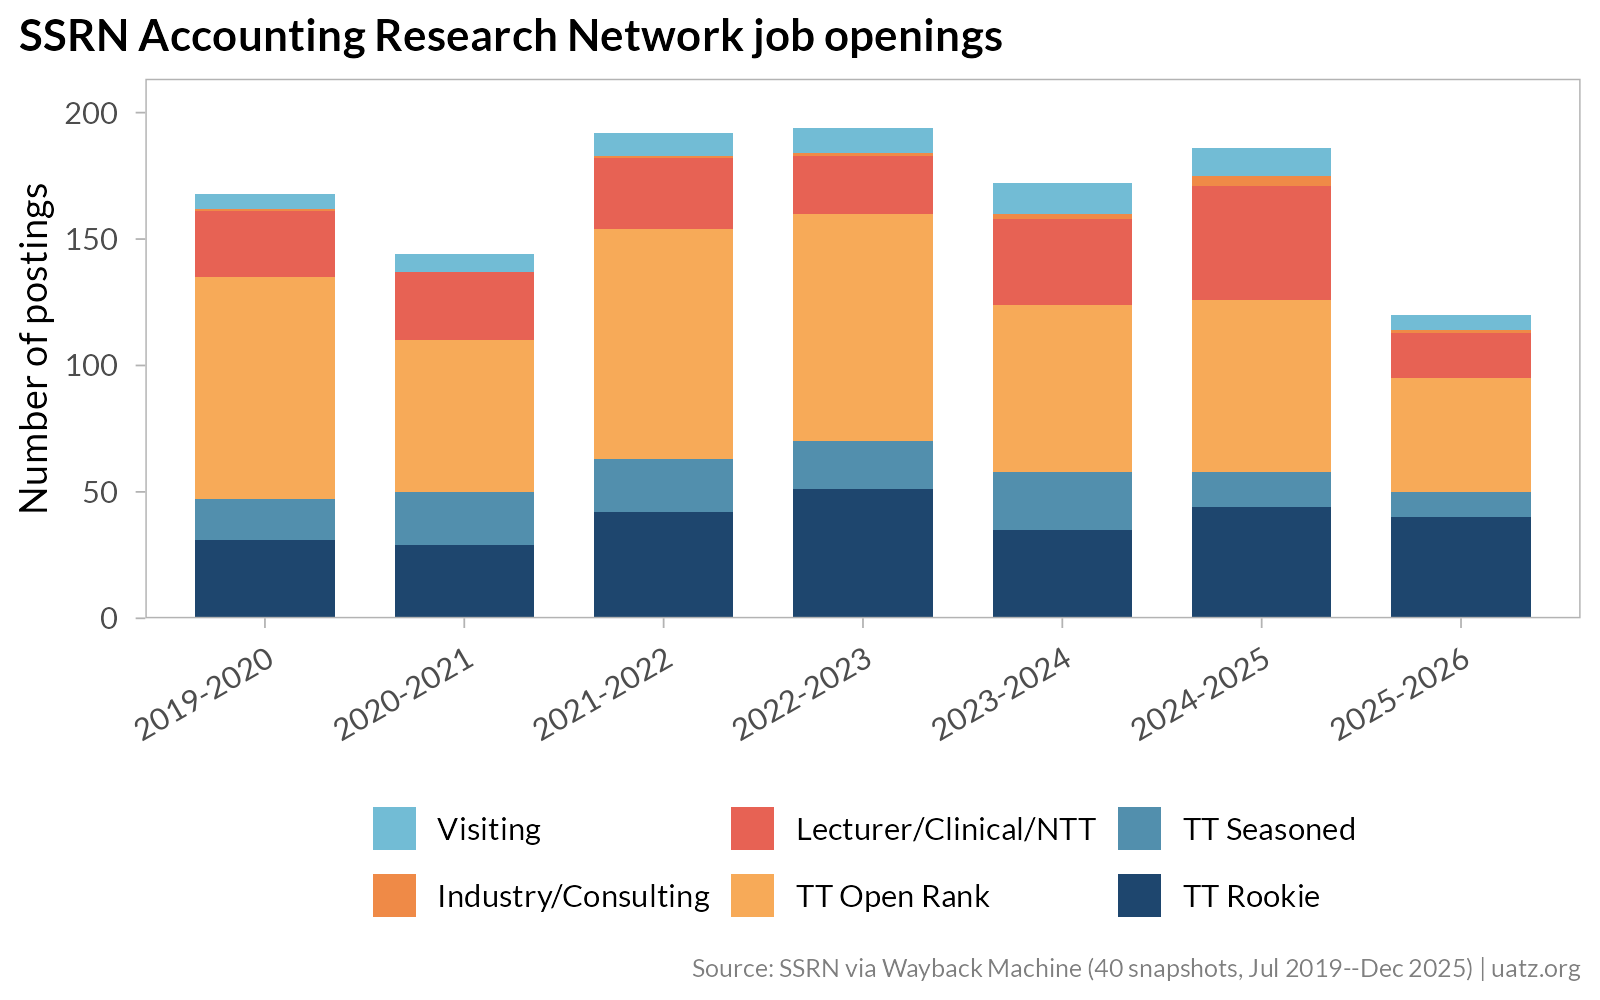
SSRN Accounting Research Network job openings
SSRN’s Accounting Research Network job openings page provides an independent source. I scraped 40 Wayback Machine snapshots from July 2019 through December 2025, so these counts are a lower bound: postings that appeared and disappeared between snapshots are not in the data.
The SSRN data tells a broadly similar story to the spreadsheet but adds detail on position types. Tenure-track rookie positions (assistant professor searches aimed at new PhDs) have held relatively steady at 30 to 50 per year. Open-rank postings make up the largest share, which is partly an artifact of how departments write their ads. Industry and consulting positions (Cornerstone, NERA, Analysis Group) are a visible and growing slice.
Bonus: R1 universities vs the rest
The spreadsheets from 2024-25 onward include a Carnegie classification field. R1 placements are stable at 40 to 70 per year, while the “Other” category drives most of the year-to-year variation. The cumulative postings chart, limited to the last three years and split by R1 status, makes the same point from the demand side.
Conclusion
The accounting PhD job market appears to be reasonably stable over the past six years, with 300 to 440 postings per cycle depending on the year (and how much you believe the data source). Financial accounting continues to dominate placements. Most hiring activity happens in the fall, and candidates who are ready early have an advantage.
These numbers cannot tell you about the quality of jobs or the experience of being on the market. They also cannot separate the real effects from changes in who bothers to update a Google Sheet.